Introduction
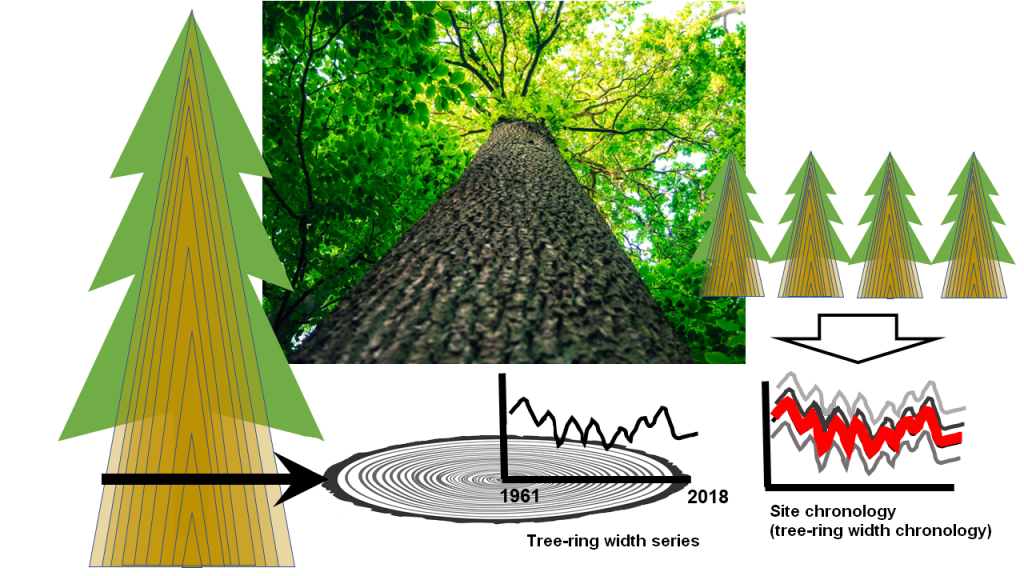
Tree rings represent annual increments of wood around the circumference of the tree trunk. Therefore, tree rings are a direct source of information about the past variation in radial growth rate (see figure). Wood production is the most important component of aboveground biomass production in forest ecosystems. It is crucial both economically and concerning the sequestration of atmospheric carbon into biomass. The intensity of wood production varies from year to year, turning tree-ring widths into proxies of the vitality and growth dynamics of individual trees. Therefore, trends in wood production, its intra-annual variation, and climate-growth responses can be determined by the measuring and statistical processing of tree-ring widths. The tree-ring width series (a time series of the ring widths of a particular tree in each year) provides us with information on growth dynamics over the decades to centuries. At a single site, changes in annual ring widths over time are mainly driven by climate, long-term changes in species composition, and the social status of individual trees. By contrast, resource availability (water, nutrients) and topographic conditions often account for a significant part of the variation in growth patterns between sites.
As information on tree growth is important from both economical and ecological points of view, dendrochronological studies have recently been carried out on an increasing number of sites across the Czech Republic. As a result, the set of available tree-ring series produced by individual research groups and laboratories has gradually expanded. In the Czech Republic, the collection of tree-ring data from living trees began in the 1960s. Due to the high number of tree-ring series obtained from the territory of the Czech Republic (tens of thousands of series), it is possible to use such data to comprehensively describe the impact of climate change on forest ecosystems and to predict the response of selected tree species to future climatic conditions. This is the main objective of the TreeDataClim project. Within this project, individual dendrochronology laboratories and research groups are sharing their data and producing robust results focusing on the relationship between tree growth and climate. Within the database, each site is represented by a tree-ring width series of individual trees and their site-specific mean, the so-called site chronology, which amplifies the prevailing growth pattern of given site.
Database structure
In addition to the tree-ring data, spatial variables describing the geographical and ecological conditions at a given site are also available in the database. These data have the format of continuous grids covering the whole territory of the Czech Republic. Grids include data on soil fertility, water availability, and historical climatic time series. The climatic data were produced from station data of the Czech Hydrometeorological Institute and relevant stations of the Deutsche Wetterdienst. Using orographic regression (monthly mean temperatures) and IDW interpolation (monthly precipitation totals), grids with a resolution of 1 × 1 km were created for each month of the period 1961-2019. The climatic data are stored in netCDF format.
Scripts in R and Python were developed for individual steps of data importing into the database and subsequent analyses. The database was created in the PostgreSQL/PostGIS environment and is hosted on the server of the Faculty of Science, Charles University, Prague.
Main types of analyses
1. Extreme growth reductions of the major forest tree species
The identification of extreme growth reductions was based on the methodology published by Treml et al. (2022, https://doi.org/10.1111/gcb.15922). The approach determines the recurrence frequencz for each negative fluctuation of tree-ring width (=decline) in site chronology. For each site, we calculated critical values of growth declines that are reached on average once every 2, 3, 4, … X years. The extreme growth reduction was defined as an event occurring on average once per 40 years. Next, the years with the highest frequency of sites showing such extreme growth reduction were selected for each species. The magnitude of extreme growth reductions in these years was spatially interpolated by regression based on site coordinates, elevation, and soil characteristics.
2. Current growth trends of the major forest tree species
Current growth trends of major tree species were analyzed between 1990 and 2018, i.e., a period of rapid temperature increase. The tree-ring width series were first converted into basal area increments, i.e., 2-dimensional variables indicating annual increments in the area of the stem horizontal projection. The series of basal area increments were fit with a GAMM model. The predictors of the trend included the age and size of the tree in a given year. Subsequently, the average tree growth over the period 1990-2018 was predicted based on the parameterized GAMM model. Because growth trends at most sites varied considerably between the 1990s and the post-2005 period, the growth trends were assessed separately for the 1990-2005 and 2005-2018 periods. Within these intervals, the average growth trends predicted by the GAMM model were approximated by linear regression. The slopes of these linear equations for each site were then spatially interpolated across the entire Czech Republic. The spatial regression considered predictors of site coordinates, elevation, and soil characteristics. In the case of species with statistically insignificant spatial regression models, the interpolation was performed by kriging.
3. Climatic limitation of growth of the major forest tree species
Tree-ring width chronologies were used to calibrate the climate-driven tree growth model VS-Lite (Tolwinski-Ward et al. 2011, https://doi.org/10.1007/s00382-010-0945-5). Model outputs include, but are not limited to, monthly data on the total growth rate, growth rate under optimal climate conditions, and growth deficit (i.e., percentage of potential growth that was lost due to low temperature, low soil moisture, or their combination). Based on these model outputs, (i) the percentage of annual growth occurring under climatically optimal conditions and (ii) the ratio of growth deficits due to low soil moisture and low temperature were calculated for each site. Both these indices were interpolated using spatial regression based on site coordinates, elevation, and soil characteristics.
Future research
In the last phase of the project (2023-24), we will perform similar analyses as presented above on simulated tree-ring width data based on climate scenarios for the period 2030-2060. The aim is to forecast the future growth dynamics of major tree species and their spatial variability under ongoing climate change.